In one of my earlier post (
here), I showed how to show OBIEE data on calendar. In this post I am going to show yet another way to use power of OBBIE Narrative Views to visualize OBIEE data - Squarified Treemap.
Squarified treemap is one of the most effective way to visualize tree structured data, be it a finance or any other domain. I will be using javascript toolkit from
http://thejit.org/ to create the squarified treemap. I will suggest you download the toolkit and go over the example code that comes along.
Here's tree structured report which shows the sales data of a store by Product Class, Product Subclass, Product Item. It has a "Rank" column which ranks product based on its sales value and % Share show its share in the total sales value. We will be using Rank to determine color and % Share to determine size of the rectangle in the squarified treemap.
 Create a folder name "jit" on OBIEE server under Drive:\OracleBI\oc4j_bi\j2ee\home\applications\analytics\analytics\res\ folder and copy jit.js and Treemap.css from the toolkit to this folder.
Next we create narrative view and write javascript to use treemap control and pass the report data do it. Note: When I was designing it, preview under narrative was showing a black rectangle. However, I could save the report and view treemap in the result / dashboard view.
 Here's the script from the narrative view.
Prefix:
<!-- JIT Library File -->

<script language="javascript" type="text/javascript" src="./res/jit/jit.js"></script>

<!-- JIT Stylesheet File -->

<link type="text/css" href="./res/jit/Treemap.css" rel="stylesheet" />

<script language="javascript" type="text/javascript">

      function init() {
            function itemdata() { this.rank = ""; this.share = ""; }
            var rdata = [];
In Prefix section we include jit.js and Treemap.css files. Note the path for the files is ./res/jit. The init function will be called on load event of document body. It will build treemap using report data. The multidimensional object rdata will be used to capture report data. We will use instance of itemdata to store Rank and % Shares .
Narrative:
            if(typeof(rdata["@1"]) == "undefined")

            rdata["@1"]=[];

            if(typeof(rdata["@1"]["@2"]) == "undefined")
            rdata["@1"]["@2"]=[];

            if(typeof(rdata["@1"]["@2"]["@3"]) == "undefined")
            rdata["@1"]["@2"]["@3"]=new itemdata();

            rdata["@1"]["@2"]["@3"].rank=@4;
            rdata["@1"]["@2"]["@3"].share=@5;
Here we store report data to rdata. Being tree structure, there could be multiple rows for the same Product Class or Sub Class, so we first do a check if the element with the name is defined or not and then add it. At Product item level we use instance of itemdata and store Rank and % Share of product.
Postfix:
            function nonleafclass() {
                this.children = new Array();
                this.data = new function() { this.$area = "" };
                this.id = "";
                this.name = "";
            }

            function leafclass() {
                this.children = new Array();
                this.data = new function() { this.$area = ""; this.$color = ""; };
                this.id = "";
                this.name = "";
            }

            json = new nonleafclass();
            json.name = "Product Performance";
            json.id = "Product Performance";
            json.data.$area = 100;
            var i = 0;


            for (var cls in rdata) {
                json.children[i] = new nonleafclass();
                json.children[i].name = cls;
                json.children[i].id = cls;
                var j = 0;
                var iarea = 0;

                for (var subcls in rdata[cls]) {
                    json.children[i].children[j] = new nonleafclass();
                    json.children[i].children[j].name = subcls;
                    json.children[i].children[j].id = subcls;
                    var k = 0;
                    var jarea = 0;

                    for (var item in rdata[cls][subcls]) {
                        json.children[i].children[j].children[k] = new leafclass();
                        json.children[i].children[j].children[k].name = item;
                        json.children[i].children[j].children[k].id = item;
                        json.children[i].children[j].children[k].data.$area = rdata[cls][subcls][item].share;
                        json.children[i].children[j].children[k].data.$color = rdata[cls][subcls][item].rank;
                        jarea = jarea + rdata[cls][subcls][item].share;
                        k++
                    }

                    json.children[i].children[j].data.$area = jarea;
                    iarea = iarea + jarea;
                    j++

                }
                json.children[i].data.$area = iarea;
                i++;
            }


            var infovis = document.getElementById('infovis');
            var w = infovis.offsetWidth, h = infovis.offsetHeight;
            infovis.style.width = w + 'px';
            infovis.style.height = h + 'px';
The jit toolkit requires the data in a specific object format. In their example code they have used json syntax to define the data. In postfix section we create same object in bit different way. Note use of Rank and % Share for $color and $area properties. For nonleaf level we calculate area by summing up area of children (i.e. item).
Postfix Continue..
            //init tm

                var tm = new TM.Squarified({
                //Where to inject the treemap.
                rootId: 'infovis',

                //Add click handlers for
                //zooming the Treemap in and out
                addLeftClickHandler: true,
                addRightClickHandler: true,

                //When hovering a node highlight the nodes
                //between the root node and the hovered node. This
                //is done by adding the 'in-path' CSS class to each node.
                selectPathOnHover: true,

                Color: {
                    //Allow coloring
                    allow: true,
                    //Set min value and max value constraints
                    //for the *$color* property value.
                    //Default's to -100 and 100.
                    minValue: 1,
                    maxValue: 29,
                    //Set color range. Default's to reddish and greenish.
                    //It takes an array of three
                    //integers as R, G and B values.
                    minColorValue: [0, 255, 50],
                    maxColorValue: [255, 0, 50]
                },

                //Allow tips
                Tips: {
                    allow: true,
                    //add positioning offsets
                    offsetX: 20,
                    offsetY: 20,
                    //implement the onShow method to
                    //add content to the tooltip when a node
                    //is hovered
                    onShow: function(tip, node, isLeaf, domElement) {
                        tip.innerHTML = "<div class=\"tip-title\">" + node.name + "</div>" +
                "<div class=\"tip-text\">" + this.makeHTMLFromData(node.data) + "</div>";
                    },

                    //Build the tooltip inner html by taking each node data property
                    makeHTMLFromData: function(data) {
                        var html = '';
                        html += "Share in Sales" + ': ' + data.$area + '%<br />';
                        if ("$color" in data)
                            html += "Rank" + ': ' + data.$color + '<br />';
                        return html;
                    }
                },

                //Remove all element events before destroying it.
                onDestroyElement: function(content, tree, isLeaf, leaf) {
                    if (leaf.clearAttributes) leaf.clearAttributes();
                }
            });
            //load JSON and plot
            tm.loadJSON(json);
            //end
        }    //init

        document.body.onload=function() { init() };
</script>

<div id="center-container" style="width:700px;background-color:#1a1a1a;color:#ccc;height:500px;">
     <div id="infovis" style="width:700px;height:500px;margin:auto;overflow:hidden;position:relative;"></div>
</div>
<div id="log">
</div>
The above code is picked from the example. It initializes the squrified treemap from the toolkit and setup necessary property. The name of DIV tag where treemap will be rendered is infovis. I changed maxvalue property of color to 29, since I have 29 rows on my report. You can even calculate this value dynamically if required. Also, I modified makeHTMLFromData to use information from the report. This will be shown as tooltip on the treemap. The line tm.loadJSON(json) passes the data we prepared to treemap control. As mentioned earlier we bind call to init function on load event of the page. Finally, we create required DIV tags.
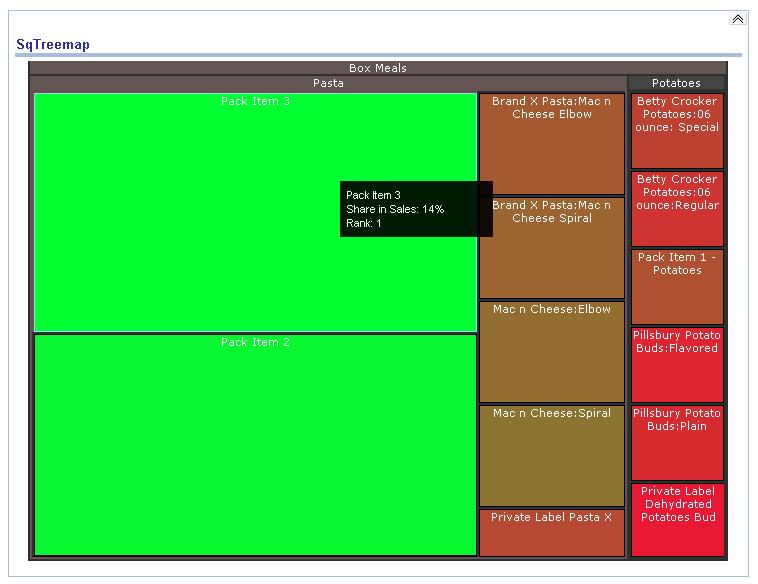
Don't miss-out to select "Contains HTML Markup" checkbox. Here is how report looks once saved and placed on the dashboard. When you hover treemap, it show tooltip for specific item. Note the color change based on rank from bright green (1) to bright red (29). Also, note the size of rectangle is according to % Share in sales value.
 You can drilldown to any level in the treemap to analyze specific area using left mouse click. For example, I drilled-down here to leaf level member that has rank of 26.

Right mouse click will drill one level up. When I, right clicked above I get following.
 And then one more level up.

You can also jump to any specific level in the tree. For example, below I can click on Product Class - Cereal and it will present the data under it.

 I hope this post will be helpful for those who are looking to implement squarified treemap visualization over OBIEE dashboard.
The jit toolkit has many other visualization controls. I will try to cover them in my future post.




 Posts
Posts


